Verismall Software
Measurements Of Location For Statistics
Measurements Of Location For Statistics
Couldn't load pickup availability
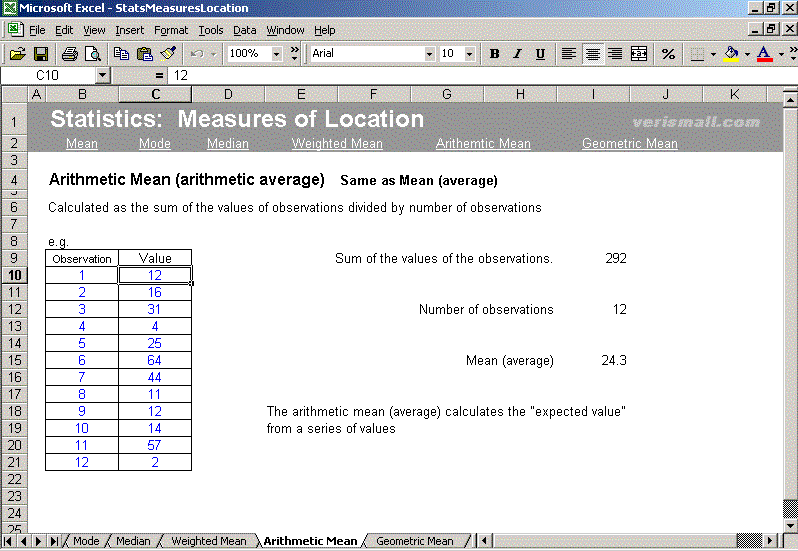
Unlock the Power of Statistics with Our Excel Spreadsheet on Measurements of Location!
Are you looking for an easy, practical way to understand statistical measurements of location such as mean, median, mode, quartiles, percentiles, and midrange? Our Excel-based statistics spreadsheet is the perfect solution for students, data analysts, researchers, and business professionals who need a clear, hands-on guide to these essential concepts.
✅ What You’ll Get:
-
Formulas pre-built for accurate calculations.
-
Step-by-step examples and explanations of each measure of location.
-
Interactive data input sections to test and analyze your own datasets.
✅ Why This Spreadsheet is a Must-Have:
-
Saves Time: No need to write formulas manually—everything is ready for you.
-
Boosts Understanding: Learn by doing with practical examples.
-
Versatile: Perfect for college statistics projects, business data analysis, or self-study.
Keywords: Excel statistics template, measures of central tendency, mean median mode Excel, statistical data analysis spreadsheet, descriptive statistics, Excel tutorial for statistics, statistics calculator Excel, quartile and percentile calculation Excel.
Start mastering descriptive statistics today with this user-friendly, professional Excel tool—the easiest way to learn and apply measurements of location in real-world data analysis!
Share